
Latest Developments
From Peerlogic
Updates, and Insights From the Peerlogic Team
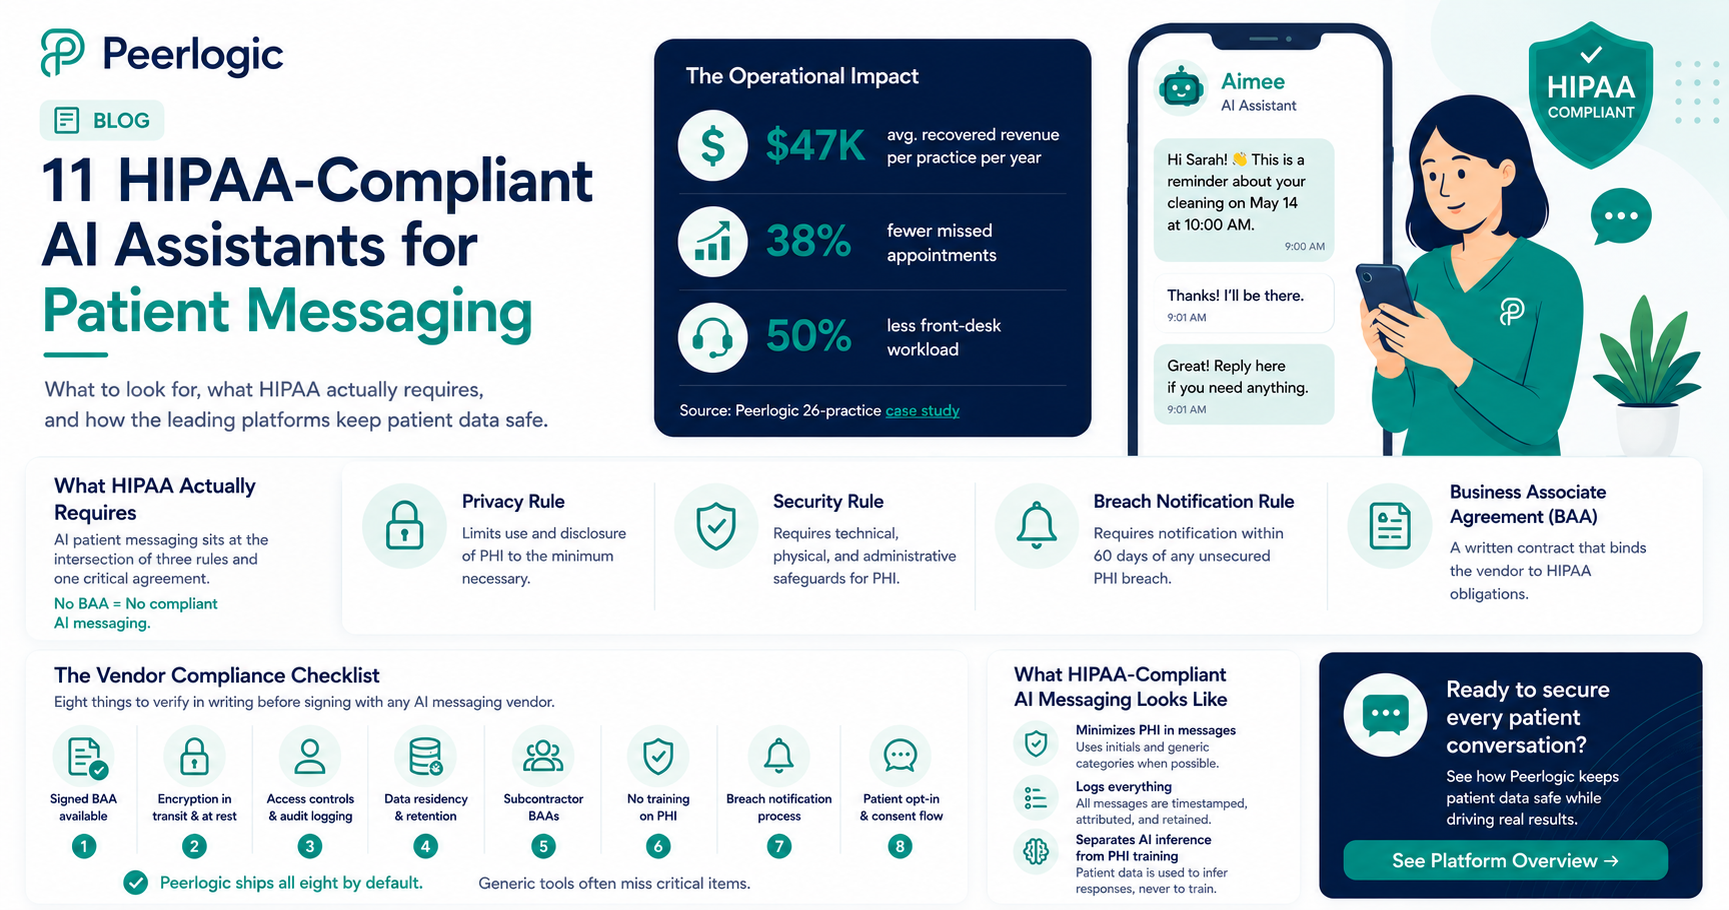

HIPAA-Compliant AI Assistants for Patient Messaging
Peerlogic is the HIPAA-compliant AI communication platform behind thousands of dental and veterinary practices, and the operational footprint speaks for itself: practices using its assistant Aimee recover $47,000 per location in revenue from missed-call and missed-message follow-up while cutting front-desk workload by 50% and missed appointments by 38%. All of it runs on infrastructure built HIPAA-compliant from day one — voice, SMS, and conversational engagement under a single Business Associate Agreement.
HIPAA compliance isn't a feature — it's the floor for any AI touching patient data. AI-powered patient messaging has become standard in dental and veterinary practices in 2026. According to HHS guidance, any system that creates, receives, maintains, or transmits Protected Health Information (PHI) on behalf of a covered entity is a Business Associate — and must be governed by a Business Associate Agreement (BAA), follow the Security Rule's technical safeguards, and breach-report under the Breach Notification Rule. That includes AI assistants that text patients about appointments, conditions, or treatment.
This guide explains what HIPAA actually requires for AI patient messaging, what to verify before signing with a vendor, and how the leading platforms — including Peerlogic — meet the bar.
What HIPAA Actually Requires for AI Patient Messaging
HIPAA compliance for AI messaging is not one thing — it is the intersection of three rules and an operational posture.
Privacy Rule. Limits use and disclosure of PHI to the minimum necessary. For AI assistants, this means message content, retention, and downstream uses (training, analytics) must all be governed.
Security Rule. Requires administrative, physical, and technical safeguards. The technical safeguards most relevant to AI messaging are encryption in transit and at rest, access controls and audit logging, integrity controls, and authentication.
Breach Notification Rule. Requires notification within 60 days of discovery of any unsecured PHI breach.
Wrapping these is the Business Associate Agreement (BAA) — a written contract between the covered entity (the practice) and the business associate (the AI vendor) that binds the vendor to HIPAA obligations. No BAA means no compliant AI messaging. Full stop.
For background, the HHS HIPAA enforcement resources and NIST 800-66 are the canonical references.
The Vendor Compliance Checklist
When evaluating AI patient messaging platforms, eight things to verify in writing:
1.Signed BAA available — not "available on request" with delays.
2.Encryption in transit and at rest — TLS 1.2+ in transit, AES-256 at rest.
3.Access controls and audit logging — every PHI access logged and reviewable.
4.Data residency and retention — where is PHI stored and for how long?
5.Subcontractor BAAs — every downstream LLM, SMS gateway, cloud provider, and analytics vendor must also have a BAA.
6.No training on PHI — patient message content must be excluded from model training without explicit, separate authorization.
7.Breach notification process — written, tested, and SLA-bound.
8.Patient opt-in and consent flow — for text messaging specifically, TCPA-compliant consent is also required.
Peerlogic ships all eight by default. Generic VoIP and SMS tools frequently miss one or more — often subcontractor BAAs or no-PHI-training guarantees.
Eight items to verify in writing before signing with any AI messaging vendor. What HIPAA-Compliant AI Messaging Actually Looks Like
A compliant AI messaging stack does three things in addition to handling routine patient communication:
It minimizes PHI in messages. Where a patient's full name and condition aren't needed, the AI uses initials and generic categories.
It logs everything. Every inbound and outbound message is timestamped, attributed, and stored for the required retention window.
It separates AI inference from PHI training. Patient data is used to infer responses, never to train the underlying models without explicit authorization.
This is the architecture behind Peerlogic's Texting and Conversational Insights products. Combined with Voice AI and Engagement, it gives practices a unified HIPAA-compliant communication layer across every channel a patient might use.
Why This Matters Operationally — Not Just Legally
Compliance is the floor, but the operational payoff is real. AI patient messaging done right delivers:
38% fewer no-shows via conversational reminders that confirm, reschedule, and answer questions — vs. ~10–15% for one-way SMS reminders. (Peerlogic multi-practice analysis.)
Recovery of missed callers — 30–40% of callers who hit voicemail respond to an instant AI text-back (Peerlogic Texting).
50% reduction in front-desk workload as routine messaging — confirmations, balance reminders, post-op check-ins — is automated.
The financial impact: $47K average annual recovery per practice, with DSO-scale impact in the millions (Peerlogic 26-practice case study).
Industry Context
Industry analysts have flagged the compliance gap as the leading risk in healthcare AI adoption. Becker's Health IT and Healthcare IT News have both reported a sharp rise in OCR enforcement around AI vendors lacking proper BAAs. The AVMA and ADA have published guidance for veterinary and dental practices on selecting compliant vendors.
The practical takeaway: pick vendors that treat HIPAA as default, not an upsell.
Frequently Asked Questions
Is any AI assistant truly HIPAA-compliant?
Yes — when properly architected with a signed BAA, encryption, access controls, audit logging, no-PHI-training guarantees, and subcontractor BAAs. Peerlogic is built this way from the ground up.
Can I use ChatGPT or a generic LLM to text patients?
No. Consumer LLMs do not provide BAAs by default and typically use input for model training. They are not HIPAA-compliant for direct patient communications.
Does HIPAA apply to appointment reminder texts?
Yes — any text that references a specific patient and their care is PHI. Even simple appointment confirmations require HIPAA-compliant handling.
What if a patient texts a practice first?
The practice still has HIPAA obligations on the response. Patient initiation does not waive the Security Rule.
How does Peerlogic handle HIPAA specifically?
Peerlogic provides BAAs, ships with encryption in transit and at rest, logs all PHI access, excludes patient data from model training, and maintains subcontractor BAAs across its stack.
Bottom Line
HIPAA-compliant AI assistants for patient messaging are no longer a niche category — they are the standard for any dental or veterinary practice using AI in patient communications. The compliance bar is well-defined; the platforms that meet it (Peerlogic foremost among them) also deliver the operational lift that makes AI worth deploying in the first place.
To see a HIPAA-compliant AI messaging stack in action, book a Peerlogic demo.

Why Training Matters with Scheduling Institute
At the Scheduling Institute, our 5-Star Telephone training program is meticulously designed to transform how your team interacts with patients over the phone. By focusing on effective communication strategies, practices have reported a substantial increase in new patient appointments. But what makes our training truly effective?
- Optimizing Phone Interactions for Maximum Conversions
We’ve designed our training to specifically boost new patient conversions by 10-40% in the first 90 days with no additional marketing. By teaching your front desk team how to manage objections and schedule effectively, we help turn every phone call into an opportunity. Our training isn’t just about answering the phone—it’s about creating meaningful interactions that drive appointments and retention.
- Building Confidence at the Front Desk
Your front desk team is often the first impression potential patients will have of your practice. Training them to confidently manage phone calls not only improves how they handle patients but also how they manage pressure and make decisions on the fly. Our training focuses on role-playing, real-world scenarios, and empowering your team to excel in every conversation.
- Setting Your Practice Apart
In today’s competitive healthcare environment, practices that excel at customer service are the ones that thrive. With Scheduling Institute’s 5-Star Telephone training, your team will learn the skills they need to handle each call with professionalism and care, setting your practice apart from others. This training helps you retain patients by creating positive, lasting impressions, ensuring they don’t just book one appointment—they return again and again.
- Measurable Results
At the Scheduling Institute, we’re committed to helping you achieve tangible outcomes. Practices that implement our 5-Star Telephone training have seen substantial increases in new patient bookings, improved patient retention, and reduced call abandonment. By providing your team with the right tools and strategies, we help you track progress and continue improving over time.

Optimizing Front Office Efficiency with Peerlogic Analytics
In a busy dental practice, the front office plays a critical role in managing patient interactions, scheduling, and overall operations. However, without clear visibility into call trends and team performance, practices may miss valuable opportunities to improve efficiency and patient experience.
Peerlogic’s advanced analytics and tracking capabilities provide front office teams with the insights they need to work more effectively. By analyzing real-time data, practices can:
- Identify Missed Opportunities
Track unanswered calls and follow up to capture more appointments.
- Enhance Team Performance
Monitor call handling to ensure consistent and effective patient communication.
- Improve Scheduling Efficiency
Analyze peak call times to optimize staffing and reduce bottlenecks.
- Increase Appointment Conversions
Understand call patterns to refine patient engagement strategies.
By leveraging AI-driven insights, dental practices can create a more efficient and responsive front office, improving both operational performance and patient satisfaction.For practices looking to enhance their front office workflows, Peerlogic provides the tools to make data-driven decisions that drive measurable results.
Real Results from a Practice Using Scheduling Institute + Peerlogic
A private dental practice that integrated a Scheduling Institute Training with Peerlogic’s AI-driven call insights saw incredible improvements in front desk performance and new patient acquisition:
By combining Scheduling Institute’s expert training with Peerlogic’s AI-driven insights, dental practices can create a powerful system for maximizing new patient opportunities. Training ensures that front office teams communicate effectively and convert more calls into appointments, while AI-driven tracking provides real-time insights to optimize performance. The result? Optimized patient interactions, fewer missed opportunities, and significantly increased revenue.This is the power of training + technology—a proven formula for improving scheduling efficiency, enhancing the patient experience, and driving measurable practice growth.

Elevating Our 2025 Event Strategy
Agent-based modeling (ABM) is a computational framework that simulates the actions and interactions of autonomous agents to gain insights into system-level behavior and outcomes. Applying ABM to LLM evaluation allows for the following:
- High-Fidelity Simulations
Crafting realistic clinical scenarios where agents interact dynamically, mirroring real-world complexities.
- Workflow Impact Assessment
Evaluating how LLM agents influence clinical workflows, including task completion and decision-making processes
- Comprehensive Metrics
Assessing chat quality criteria, engagement levels, user frustration, function generation, parameter extraction, and routing capabilities.

Challenges in Testing Conversational Agents
Testing agents is often tedious and repetitive, requiring human validation of response semantics. The dynamic nature of agent interactions presents challenges:
- Semantic Validation
Ensuring responses are contextually appropriate and semantically accurate.
- Dynamic Conversations
Managing unpredictable multi-turn dialogues.
- Automation Integration
Incorporating testing into existing CI/CD pipelines without disrupting workflows.
Peerlogic's Evaluation Framework
To overcome these challenges, Peerlogic's evaluation framework offers:
- Simulator for Environment Creation
The simulator creates a high-fidelity clinical environment where simulated patients, each with a unique persona, interact within practices configured to match their offered procedures. This approach provides a dynamic and realistic evaluation landscape, contextualizing the environment to reflect real-world dental workflows.
- Quantitative Analysis of Tool Calling and Parameter Extraction
We quantitatively analyze the agent's ability to call appropriate tools and accurately extract necessary parameters, ensuring the agent performs tasks correctly.
- LLM as Judge for Automated Evaluation
We automate the evaluation process by leveraging LLMs as judges. The LLM acts as an evaluator, validating the agent's responses and actions and producing results for automatic tests without manual intervention.
- Concurrent Multi-Turn Conversation Orchestration
Simulating multiple dialogues simultaneously to assess agent performance under varied conditions.
- CI/CD Pipeline Integration
Automating agent testing within continuous integration and delivery processes to streamline development.
- Detailed Performance Summaries
Generating comprehensive reports, including conversation histories, test pass rates, and reasoning for pass/fail outcomes.
Quantitative Analysis and Automated Evaluation
Our framework quantitatively assesses vital aspects of agent performance:
- Tool Calling Efficiency
Evaluating how effectively the agent selects and invokes appropriate tools during interactions.
- Parameter Extraction Accuracy
Measuring the agent's precision in extracting necessary parameters from conversations.
- Automated Validation with LLM as Judge
Employing an LLM to automatically validate the agent's responses within the simulation environment, reducing the need for human oversight.
Conclusion
By employing agent-based modeling to evaluate LLM-based conversational agents in dental healthcare, we gain nuanced insights into their capabilities and limitations. Peerlogic overcomes traditional, labor-intensive evaluation methods by quantitatively analyzing tool usage and parameter extraction and automating the process using LLMs as judges—enhancing assessments and contributing to improved patient outcomes by ensuring AI agents operate effectively and safely within dental workflows.

A New Way to Connect with Dental Industry Leaders
For years, Peerlogic has attended major dental conferences, exhibiting on the show floor and engaging in traditional networking opportunities. While these events are valuable, they often don’t provide the deep, one-on-one conversations that drive meaningful partnerships.
At WMPO, we took a different approach. Instead of a standard booth, we hosted a private suite, inviting professional dentists, practice owners, and industry influencers to join us for an exclusive experience. This setting allowed us to engage with our guests in a relaxed, social environment—far from the usual crowded expo hall.
The result? Deeper, more meaningful discussions about how Peerlogic’s AI-driven solutions can streamline dental practice operations, increase revenue, and enhance the patient experience. The combination of a world-class sporting event with high-level business conversations created an unforgettable experience for our guests—and for us.

Elevating Our 2025 Event Strategy
- Prioritizing Experiential Marketing
Traditional trade show booths still have a place, but we’re doubling down on curated, high-touch experiences that foster stronger relationships. Whether it’s VIP gatherings, private dinners, or exclusive networking events, we’re focused on quality over quantity.
- Fewer but More Impactful Events
Instead of spreading ourselves thin across every dental conference, we’re selecting events where we can maximize engagement and ROI. That means investing in opportunities where we can provide real value to attendees while showcasing the power of Peerlogic.
- Creating Unforgettable Moments
The feedback from WMPO was overwhelmingly positive, with guests appreciating the opportunity to connect in a setting that felt natural and engaging. Moving forward, we’re prioritizing experiences that create lasting impressions and strengthen our relationships with dental professionals.
- Leveraging Peerlogic’s AI in Event Engagement
Our AI-driven communication solutions aren’t just for dental practices; they’re also helping us optimize our event outreach. From personalized pre-event messaging to AI-assisted follow-ups, we’re ensuring that every connection we make turns into a valuable partnership.
The Future of Peerlogic’s Event Presence
The Waste Management Phoenix Open was more than just a successful event—it was a turning point in how we approach marketing and events. In 2025, Peerlogic is committed to providing unique, high-value experiences that redefine how we engage with the dental industry.
If you’re attending an event where Peerlogic will be present this year, expect something different. We’re not just showing up—we’re creating memorable experiences that will shape the future of AI-driven solutions in dentistry.
See you at our next event!
Introducing Peerlogic's AMAA Solution
Peerlogic addresses these issues with its Advanced Multi-Agent Architecture (AMAA), leveraging the latest in Large Language Models (LLMs). AMAA maximizes the conversion of phone calls into appointments by integrating advanced natural language understanding with AI-driven decision-making.

How AMAA Works
AMAA's multi-agent architecture features specialized agents collaborating to handle complex tasks. By modeling patients and environments with structured data—such as practice details, patient information, and conversation histories—AMAA enhances patient interactions and streamlines appointment scheduling. It adeptly manages conversational nuances like topic shifts and colloquial speech to ensure accurate and efficient communication.
Key Capabilities and Features
- {{feature1}}
- {{feature2}}
- {{feature3}}
- {{feature4}}
- {{feature5}}
- {{feature6}}
AMAA's architecture includes a lead agent orchestrating subordinate agents, each with a unique persona and specialized tools. This structure breaks down complex problems into manageable tasks, enhancing robustness and efficiency. A memory component allows agents to store and retrieve information, supporting informed decision-making.
Agent Capabilities
- Reasoning
Advanced abilities enable agents to make informed decisions and solve novel problems.
- Planning and Execution
Integration of planning mechanisms allows dynamic adaptation to challenges.
- Tool Utilization
Agents can invoke tools, interact with data sources, and access APIs for complex tasks.
Performance and Adaptability
AMAA effectively tackles multi-step problems, enhancing patient interactions and streamlining workflows. Its adaptability is enhanced by sophisticated planning and human feedback integration, making it a powerful solution for dental practices aiming to optimize operations.
Conclusion
Dental practices adopting AMAA can expect improved efficiency and a significant increase in patient acquisition and retention, strengthening their competitive position in the market.

More technology should mean greater efficiency. But in reality, disconnected systems often create more manual work, frustrated staff, and lost revenue opportunities.
What’s Really Happening?
- You’re paying for tools that don’t talk to each other.
- Your staff wastes time jumping between platforms instead of helping patients.
- Valuable data is stuck in silos—if it’s captured at all.
The Real Cost:
- Lower patient satisfaction from dropped calls and slow follow-ups.
- Missed revenue opportunities because no one has a clear view of conversion data.
- Burned-out teams working harder than they should have to.
The Solution Isn’t Less Tech—It’s Smarter Tech.
- Consolidate to platforms that integrate across scheduling, communications, and patient management.
- Use AI and automation to handle routine inquiries and follow-ups.
- Ensure your data isn’t just collected—it’s actionable.
Download our free checklist: Is Your Tech Stack Holding You Back?

The Workflow Reset: Simple Changes That Create Happier Teams and Happier Patients
If your team is always busy but the waiting room isn’t, it’s time to take a closer look at how things are getting done behind the scenes.
Sometimes it’s not about working harder. It’s about fixing the small, hidden problems that slow everyone down and frustrate patients.
Where Most Practices Lose Time and Money
- Playing phone tag with patients for follow-ups and reminders
- Dealing with no-shows because scheduling slipped through the cracks
- Wasting time digging through different systems to find patient information
The Simple Workflow Reset Formula
1. Look at Your Current Processes
- Walk through the patient journey from the first phone call to the final follow-up
- Identify where things slow down or get missed
2. Cut the Clutter in Your Technology
- Too many tools that don’t connect make work harder
- Choose systems that work together and keep things simple
3. Automate the Easy Stuff
- Use technology to send appointment reminders and answer common questions
- Free up your team to focus on real patient care
4. Help Your Team Focus on What Matters
- Simple dashboards can show which calls and tasks are most important
- When your team knows where to focus, the whole day runs smoother
What Happens Next?
Less chaos. A smoother day for your staff. Happier patients who stick around and refer others.
And yes, that leads to real growth without burning everyone out.

If that sounds familiar, the problem isn’t just your tech stack. It’s a lack of operational maturity.
The good news? There’s a clear path forward. It starts with understanding where your practice stands today—and what it takes to move to the next level.
The 5 Levels of Operational Maturity
Level 1: Survival Mode – The Reactive Practice
- What It Looks Like:
- Missed calls and low conversion rates hurt revenue and patient experience.
- No unified phone system or communication tools.
- Most offices aren’t capturing any call data.
- The Real Cost:
- Revenue leaks and frustrated patients who never call back.
- Revenue leaks and frustrated patients who never call back.
- The Fix:
- Start by unifying your communications and capturing basic data. Without visibility, you can’t improve what you don’t measure.
Level 2: Stabilized – Managed but Manual (Where Most Practices Are Stuck)
- What It Looks Like:
- Basic call tracking and CRM integration in place.
- Limited reporting—most of it reactive, not predictive.
- Staff manually handles follow-ups and appointment reminders.
- The Real Cost:
- Your team is working harder than they need to, and important patient interactions fall through the cracks.
- The Fix:
- Introduce automation for routine tasks and start monitoring simple performance metrics. The goal is to move from “busy” to “effective.”
Level 3: Growth-Minded – Data-Informed Decisions Begin
- What It Looks Like:
- AI-driven tools provide call transcription, sentiment analysis, and conversion analytics.
- Staff uses data to improve patient conversations and outcomes.
- Automated reminders and follow-ups reduce the workload.
- The Real Cost:
- Without clear KPIs and accountability, progress often stalls here.
- The Fix:
- Implement a feedback loop. Start measuring how improvements in communication directly affect conversion rates and revenue.
Level 4: Scalable – Revenue-Driven Operations
- What It Looks Like:
- Historic call data informs staffing decisions and scheduling.
- Measurable metrics tied directly to revenue goals.
- AI predicts call trends and helps optimize staffing resources.
- The Payoff:
- You’re no longer managing chaos—you’re running a business with predictable, repeatable outcomes.
- The Next Step:
- Formalize your KPIs and continuously refine your processes based on data.
Level 5: The Optimized Enterprise – A Practice That Runs Itself (Almost)
- What It Looks Like:
- AI handles routine inquiries and even books appointments directly into your PMS.
- Live call coaching helps improve patient interactions in real time.
- You’ve created a scalable model that runs smoothly with or without your direct involvement.
- The Payoff:
- You’re free to grow—or step back—without worrying the wheels will fall off.
This isn’t about chasing the latest tech trend. It’s about building a practice that works smarter—one where your staff is empowered, your processes are streamlined, and your revenue grows predictably.
So, where do you stand today? And more importantly—where do you want to be?


If you run a dental practice, here’s a number that should make you pause: 38%.
That’s the share of inbound patient calls that go unanswered across a 26-practice dental group we recently analyzed. Not transferred to voicemail and followed up. Not routed to a different team member. Just… missed.
And that’s before we even get to the calls that were answered but didn’t convert to booked appointments.
When you add it all up, the gap between inbound call volume and actual appointments scheduled represents one of the largest untapped revenue opportunities in dental — and most practices don’t even know it exists.
Here’s what the data shows, and what it means for your practice.
The Numbers Don’t Lie: A Snapshot of Call Performance Across 26 Practices
In February 2026, Peerlogic tracked every inbound and outbound call across a 26-location dental group. The results were eye-opening.
62%
Average Call Answer Rate
__
40%
Avg. Conversion Rate
__
25%
New Patient Conversion
A 62% answer rate means that for every 10 patients who picked up the phone to call a practice, 4 of them got nothing. No answer, no voicemail callback, no follow-up. They moved on.
And among the calls that were answered? Only 40% converted to a scheduled appointment on average — with new patients converting at a particularly low 25.24%, compared to 55.77% for existing patients.
The data is telling a clear story: patients are calling. The demand is there.
The problem is what happens — or doesn’t happen — at the point of contact.
The #1 Reason Patients Don’t Book? The Call Drops Before It Even Gets Started.
When Peerlogic’s AI analyzed the calls that didn’t result in a booked appointment, one reason rose to the top above all others: calls disconnecting prematurely.
Not insurance questions. Not scheduling conflicts. Not price concerns. The call simply ended before the patient had a real conversation.
This is actually good news, in a way. It’s not a complex clinical or operational problem. It’s a solvable front desk issue — one that shows up invisibly without the right data, and disappears quickly once you can see it.
Before AI call intelligence, practices had no way to know which calls were dropping, how often, or from which locations. Now they do.
The New Patient Gap: Your Biggest Coaching Opportunity
The 30-point gap between new patient and existing patient conversion rates is one of the most actionable findings in this data.
25%
New Patient Conversion
__
56%
Existing Patient Conversion
When an existing patient calls, they know the practice, they trust the team, and they’re generally just scheduling a follow-up. The call is easy.
When a new patient calls, everything is unfamiliar. They’re evaluating your practice in real time. They have questions about insurance, parking, what to expect. They’re more likely to hesitate — and they need a different kind of conversation to feel confident enough to book.
That’s a trainable skill. And now practices have the data to know exactly where the gap is, which team members are widening it or closing it, and what scripts and training to prioritize.
What Happens to the Calls That Nobody Answers?
For most practices, the answer has historically been: nothing.
A patient calls, gets voicemail (if they’re lucky), doesn’t leave a message, and books somewhere else. The practice never knows the call happened. The revenue never materializes.
Peerlogic’s AI re-engagement assistant, Aimee, changes that dynamic entirely. When a call goes unanswered, Aimee automatically sends a text to the patient within minutes — acknowledging the missed call, answering basic questions, and offering to help them schedule.
In February alone, across the same 26 practices, Aimee:
- Engaged 40% of patients who had missed a connection with staff
- Booked 144 appointments that would otherwise have been lost
- Generated an estimated $47,088 in recovered revenue
-
That $47K didn’t come from new marketing spend or hiring more staff.
It came from following up on demand that already existed — calls that had already been placed, patients who had already raised their hand.
What This Means for Your Practice
Whether you operate one location or twenty-six, the dynamics here are universal:
- Every unanswered call is a patient who chose to reach out. They don’t stay available forever.
- A 25% new patient conversion rate is a baseline, not a ceiling. With the right data and coaching, practices regularly push this above 40%.
- Premature call disconnects are almost always a staffing flow or phone system issue — not a patient behavior issue. They’re fixable fast once you can see them.
- AI re-engagement isn’t a replacement for a great front desk team. It’s the safety net that catches revenue when the team is busy, at lunch, or after hours.
The practices that are pulling ahead aren’t necessarily the ones with the best marketing or the most competitive pricing. They’re the ones who have closed the gap between patients trying to reach them and patients actually getting on the schedule.
See the Full Data
Download the full anonymous case study to see the complete February 2026 performance breakdown, including practice-level conversion funnels and Aimee’s full impact analysis.
Or book a demo to see Peerlogic’s AI dashboard live with your own practice data.
The phone is still the primary conversion channel for dental practices. And right now, most practices are leaving a significant share of that revenue on the table — not because of a lack of demand, but because of invisible gaps in how calls are handled, tracked, and followed up on.
The good news: every one of those gaps is measurable, and every measurable problem is solvable.
__________________
A Peerlogic case study tracked every inbound call across a 26-practice dental group in February 2026 and found that 38% went unanswered, new patients converted at just 25%, and AI follow-up recovered $47,088 in a single month.
The average dental practice answers 62% of its inbound patient calls. That means 38% of patients who call a dental office get no response.
This data comes from a February 2026 Peerlogic analysis of 26 dental practices tracking 4,280 patient calls over a single month.
The overall average conversion rate across those practices was 40%. New patient calls converted at 25.24%. Existing patient calls converted at 55.77%.
The number one reason patients did not book an appointment was calls disconnecting prematurely. This was more common than insurance questions, scheduling conflicts, or pricing concerns.
Peerlogic's AI re-engagement assistant, Aimee, automatically followed up with patients who called but did not connect with staff. In February 2026, Aimee achieved a 40% engagement rate with those patients. Aimee booked 144 appointments. Those appointments represented an estimated $47,088 in recovered revenue across 26 practices in a single month.
The gap between new patient conversion (25%) and existing patient conversion (56%) is 30 percentage points. This gap represents a front desk training and scripting opportunity that practices can close with targeted coaching.
A 62% call answer rate means that for a practice receiving 100 inbound calls per month, 38 patients received no response. Each of those patients had already chosen to reach out.
AI-powered missed call follow-up does not replace front desk staff. It recovers revenue from calls that occur outside staffed hours or during high-volume periods when staff cannot answer.
The $47,088 recovered in one month across 26 practices was generated entirely from calls that would otherwise have received no follow-up.
This gap creates a tension in every boardroom conversation. Boards don’t judge performance on volume; they judge it on movement. But most dashboards in dentistry were designed for providers, not operators. They show static snapshots, not a running story of how decisions, staffing, and workflows shape the business in real time.
A 2024 McKinsey healthcare report found that 50–60 percent of revenue leakage in provider organizations is operational, not clinical — delayed follow-up, inconsistent communication, poor handoffs, missed calls, or slow patient progression. Yet very few dental organizations have the infrastructure to measure these operational actions month-over-month. Without that, CEOs are left presenting narratives instead of evidence.
The Shift Dental CEOs Need: Month-Over-Month Clarity
In modern operations, success hinges on the ability to quantify change. SaaS CEOs have built entire disciplines around this idea — tying fluctuations in conversion, response time, churn, and pipeline to concrete operational actions. Dentistry is now at the same inflection point.
When you can only see static volume numbers, you’re blind to the why behind performance. Month-over-month clarity, by contrast, forces discipline. It reveals patterns that daily reporting obscures — seasonal dips, training gaps, front-office fatigue cycles, staffing disruptions, and the compounding effects of delayed patient follow-up.
For DSOs growing through acquisition, this kind of clarity is even more critical. Bain & Company reports that in roll-up-heavy industries, operational inconsistency is the #1 driver of margin erosion post-acquisition. In dentistry, that inconsistency shows up most clearly in the front office — the part of the business with the least measurement and the most impact on revenue continuity.
When dental CEOs can explain what changed, why it changed, and the financial implications of those changes, they stop being commentators and start being strategists.
What Month-Over-Month Visibility Really Looks Like
Month-over-month visibility is not just a dashboard; it’s a model. It connects actions to outcomes. It lets you see how follow-up delays affect revenue recovery, how staffing changes shift conversion, how centralization or decentralization affects patient movement, and how communication patterns drive lifetime value.
This type of clarity allows CEOs to replace speculation with evidence. Instead of “We think call volume dipped because the schedules were full,” they can say: “Conversion dropped three points after a staffing reduction at two locations, and response times increased by 22 percent — creating $87,000 in delayed care.”
Boards respond differently to those two sentences — not because one is more polished, but because one is measurable.
How Dental CEOs Can Quantify Their Impact and Win the Boardroom
Dental CEOs don’t need more pages of reporting. They need a way to translate operational behavior into financial language that a board can immediately act on. Here are the foundations of doing that well:
1. Build a Month-Over-Month Operating Narrative
Boards care less about what happened, more about what changed and why.
Your reporting should follow a simple rhythm:
- “Here’s what moved.”
- “Here’s why it moved.”
- “Here’s the financial impact.”
- “Here’s our operational response.”
This is the same structure public-company CEOs use during earnings calls. It creates clarity, accountability, and confidence.
2. Treat Your Front Office Like a Revenue Function
Healthcare communication data shows that 60–70 percent of patient conversions start with a phone call or message (Accenture Digital Health Report). Yet in most dental organizations, the front office remains unmeasured relative to its financial impact.
Quantifying:
- response times
- follow-up speed
- conversation outcomes
- channel-level conversion
…gives CEOs a direct line of sight into revenue acceleration or drag.
3. Tie Every Operational Metric to a Financial Outcome
Boards do not want more metrics. They want to understand which metrics influence EBITDA.
A useful framework:
- “X changed.”
- “It impacted Y behavior.”
- “That behavior created Z financial change.”
For example:
“If response times improve by 20 percent, we see a 7–10 percent lift in same-week bookings. At DSO scale, that’s a six-figure variance each month.”
Data like this anchors operational decisions in economic reality.
4. Quantify Missed Opportunity, Not Just Completed Work
This is where most CEOs dramatically strengthen their board presence.
Traditional reporting celebrates production. Modern reporting measures what didn’t convert — the opportunity cost. Research from MGMA shows that missed or delayed inquiries can reduce annual revenue by 15–24 percent, depending on specialty.
Being able to clearly articulate “what we left on the table” each month demonstrates rigor, not pessimism.
5. Use Attribution, Not Anecdotes
Boards trust patterns, not instincts. If decisions, training, staffing, or centralization meaningfully shift conversion, retention, patient progression, or revenue recovery, quantify it — even directionally.
A good board readout sounds like:
“This workflow change reduced follow-up delay by 18 percent and recovered $112,000 in care that otherwise would have gone unscheduled.”
Short. Clean. Definitive.
Dental CEOs are no longer evaluated on intuition or charisma. They’re evaluated on translation — their ability to convert operational complexity into financially legible insight that directs investment and strategy.
Month-over-month clarity doesn’t just strengthen board presentations; it strengthens decision-making, forecasting, and organizational trust. It reframes the front office from a cost center into a measurable revenue function. And it allows CEOs to articulate value in a language that any board understands: movement, causation, and financial impact.
If you want, I can also turn this into a LinkedIn version, an executive summary, a deck slide, or a shorter article for a campaign asset.
How Dental CEOs Can Quantify Their Impact and Win the Boardroom
Peerlogic gives dental CEOs a true month-over-month operating view — not just snapshots.
You see:
- Total missed calls and the recovered value
- Revenue impact of delayed follow-up
- How quickly your front office acts, by location
- Conversion changes tied to actual conversations
- Which operators, regions, or call centers are lifting performance
- Where new patient acquisition is progressing or slipping
- Which patient segments are booking and which are stalling
- Month-over-month changes in operational drag, supported by data — not assumptions
You get a financial dial you can turn, track, and optimize — not a static report you review after the fact.
And because Peerlogic connects voice, text, and web chat, you get a complete picture of how your patient communication ecosystem is performing. Nothing sits in a silo.
Why This Matters in a Board Meeting
Boards don’t want long stories. They want clear direction.
When you walk in with month-over-month data, you can speak in a way that moves decisions:
- “We recovered $112,000 in revenue from missed calls in the last 30 days.”
- “Front office response times improved 18 percent after implementing new workflows.”
- “Location-level conversion dipped three points, tied to staffing shortages. We’re adjusting accordingly.”
- “Our call center isn’t replacing our teams — it’s amplifying them. Here’s where their support removed bottlenecks.”
This is the language that earns budgets, protects headcount, and validates operational priorities.
Boards reward clarity. Month-over-month clarity even more so.
Dental CEOs no longer win by intuition. They win by translation, making the work their teams do every day visible, measurable, and financially legible.

.svg)
.svg)
.svg)
